1、安装 echarts
npm install echarts --save
2、main.js 中引入
import { createApp } from "vue";
import App from "@/App.vue";
import * as echarts from 'echarts'
...
const app = createApp(App);
// vue3 给原型上挂载属性
app.config.globalProperties.$echarts = echarts;

app.use(store).use(router).mount('#app');
3、组件中使用
<template>
<div class="box right">
<div style="padding: 10px">
<div id="chart" style="width: 100%; height: 500px;"></div>
</div>
</div></template><script setup>import { onMounted, onUnmounted, reactive, getCurrentInstance } from "vue"
import { resize } from '../utils/index'
const { proxy } = getCurrentInstance()
const app = reactive({})
onMounted(() => {
const chart = proxy.$echarts.init(document.getElementById("chart"), 'walden');
init(chart)
show(chart)
resize(chart)
})
onUnmounted(() => {
clearInterval(interval)
})
const categories = (function () {
let now = new Date();
let res = [];
let len = 10;
while (len--) {
res.unshift(now.toLocaleTimeString().replace(/^\D*/, ''));
now = new Date(+now - 2000);
}
return res;
})();
const categories2 = (function () {
let res = [];
let len = 10;
while (len--) {
res.push(10 - len - 1);
}
return res;
})();
const data = (function () {
let res = [];
let len = 10;
while (len--) {
res.push(Math.round(Math.random() * 1000));
}
return res;
})();
const data2 = (function () {
let res = [];
let len = 0;
while (len < 10) {
res.push(+(Math.random() * 10 + 5).toFixed(1));
len++;
}
return res;
})();
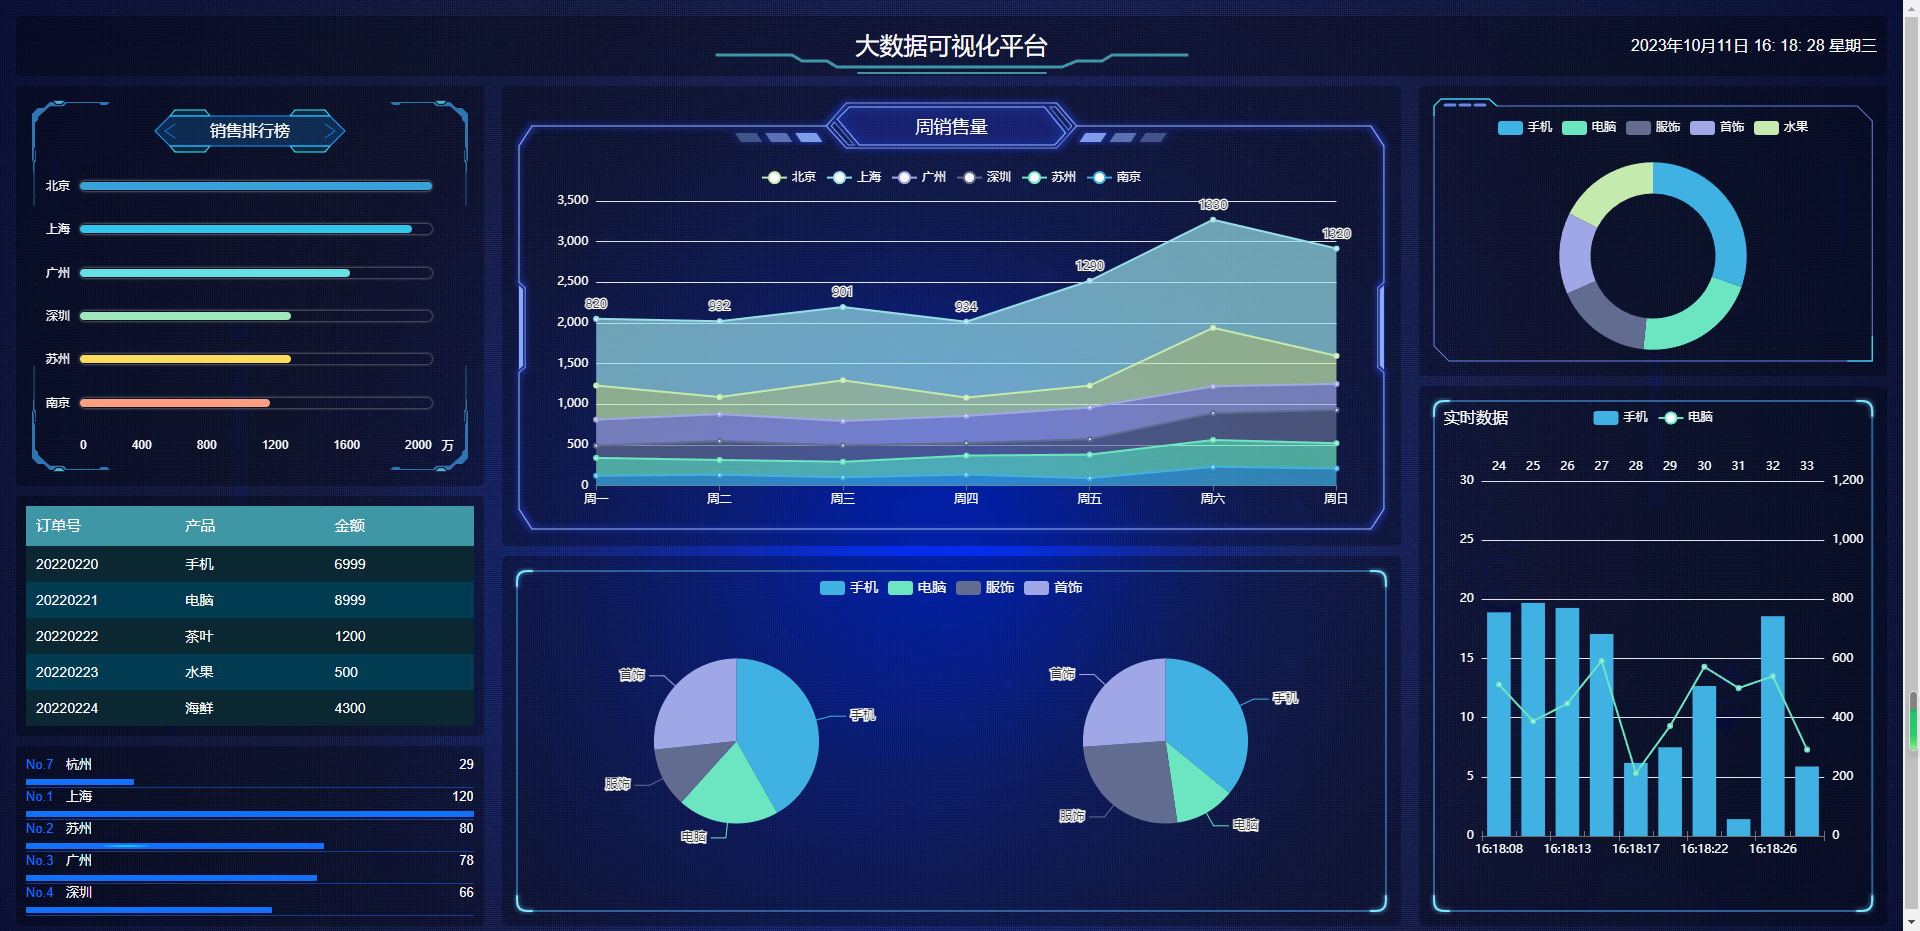
const option = {
title: {
text: '实时数据',
textStyle: {
color: "#FFFFFF",
fontSize: '16px',
fontWeight: 'normal'
}
},
grid: {
top: '15%'
},
tooltip: {
trigger: 'axis',
axisPointer: {
type: 'cross',
label: {
backgroundColor: '#283b56'
}
}
},
legend: {
textStyle: {
color: "#FFFFFF",
fontSize: 12,
fontWeight: 'normal'
}
},
dataZoom: {
show: false,
start: 0,
end: 100
},
xAxis: [
{
type: 'category',
boundaryGap: true,
data: categories,
axisLabel: {
textStyle: {
color: "#FFFFFF",
}
}
},
{
type: 'category',
boundaryGap: true,
data: categories2,
axisLabel: {
textStyle: {
color: "#FFFFFF",
}
}
}
],
yAxis: [
{
type: 'value',
scale: true,
max: 30,
min: 0,
boundaryGap: [0.2, 0.2],
axisLabel: {
textStyle: {
color: "#FFFFFF",
}
}
},
{
type: 'value',
scale: true,
max: 1200,
min: 0,
boundaryGap: [0.2, 0.2],
axisLabel: {
textStyle: {
color: "#FFFFFF",
}
}
}
],
series: [
{
name: '手机',
type: 'bar',
xAxisIndex: 1,
yAxisIndex: 1,
data: data,
},
{
name: '电脑',
type: 'line',
data: data2,
}
]
};
app.count = 10;
let interval = 0;
const show = (chart) => {
interval = setInterval(() => {
let axisData = new Date().toLocaleTimeString().replace(/^\D*/, '');
data.shift();
data.push(Math.round(Math.random() * 1000));
data2.shift();
data2.push(+(Math.random() * 10 + 5).toFixed(1));
categories.shift();
categories.push(axisData);
categories2.shift();
categories2.push(app.count++);
chart.setOption({
xAxis: [
{
data: categories
},
{
data: categories2
}
],
series: [
{
data: data
},
{
data: data2
}
]
});
}, 2100);
}
const init = (chart) => {
chart.setOption(option)
}</script><style></style>4、监听浏览器窗口变化
utils/index.js
export const resize = (chart) => {
  let timer = 0;
  window.addEventListener("resize", () => {
    clearTimeout(timer);

    timer = setTimeout(() => {
      chart.resize();
    }, 300);
  });};
5、结果展示: